Overall Indication
Good Problems
- Q27 2010: Cat losses (modelled & non-modelled), Fixed Exposures trending, Net cost of reinsurance.
- Q7 2012: Projected Ult Loss & LAE calculation: Justifications for dev factors, Frequency-Severity trends and ULAE ratio
- Here, you have to observe patterns, no matter how trivial they look
- Use all information, for e.g.
- First find the oddities in dev patterns and select appropriate ratios
- Analyze the frequency & severity trends. You can say "I will choose to select frequency and severity trends separately since they have different patterns" or "Since frequency and severity have about the same pattern, I will choose the pure premium trend directly"
- Now, using the oddities found in the dev patterns (like change in claims philosophy) and the patterns in freq and severity trends (like the book has bee growing, frequency and severity growth), you can say something about the ULAE selection perhaps!
- Balance stability with responsiveness
- Q5 2013(S): Company reduces agency commissions by 3% in the future period
- Here, we saw that 2/3 of the policies written in the future policy period of 7/1/2013 to 12/31/2014 will be written at a lower commission rate
- Approximation: Uniform writings
- Impact of the lowering of the commission on the variable expense = \(\dfrac{2}{3}\times3\% = 2\%\). Thus reduce the VE ratio by 2%.
Common sense notes
- When asked to find Projected Pure-premium (or any projected value for that matter), you have to find a single value and not just project the individual years' projected values!
- When you need a value, look for it! Don't expect that you have to always calculate the value. For example,
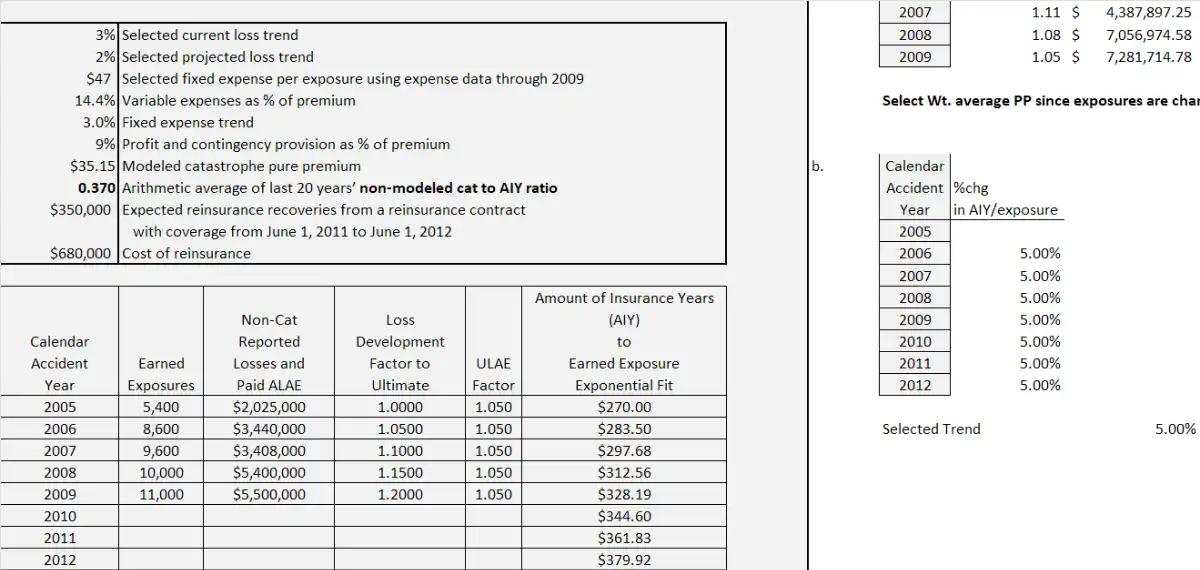
- Here, I was asked to find the Projected Non-modelled catastrophe PP
- But I started calculating the trend of AIY/exposure to find the projected AIY per exposure, and the future policy period was Jan 1, 2011 to Dec 31, 2011
- The average earned date for which was Jan 1, 2012.
- I could have just used averaged the values $361.83 and $379.92 from the extrapolated information which is already given to me.
Moral of the story: Look for it, don't start calculating it!
Fundamentals
- Stability & Responsiveness
- Three approaches are possible:
- Responsive
- Conservative (Stable)
- Balanced
- The choice is yours, if you are responsive say "To be more responsive, I will select the latest 2-year average" where you are saying I am not selecting all the years, and thus being more responsive. You will most likely use this statement
If you say conservative, "To be more conservative to this change, since I hope this won't follow in the future, I will select a latest 3-year average", where you are saying I am not selecting just the latest year, because I am afraid, this pattern might not continue in the future. You may not be using this often - The final choice is to be balanced! This is the safest approach, you can just say To balance stability and responsiveness, I will select the \(n\)-year average.
- Three approaches are possible:
- LR vs PP
- Use LR when
- Exposures are not clearly defined: e.g. Setting prices for a commercial lines product that has multiple complex exposures underlying each risk
- Exposure information is not available.
- Use PP when
- Pricing a new LOB, since existing premium is not available.
- When it is difficult to obtain accurate on-levelled premiums.
- Uneven written exposures \(\to\) Parallelogram method would provide inaccurate on-levelled premiums
- Use LR when
- Weight for AY
- When weights are given for AY, then weight the loss ratios / pure premiums that you get from each AY separately . This would actually be easier to do, and if you think about it, if you are using the pure premium approach, you would do exactly that, you wouldn't weight exposures (that doesn't make sense)
- Premium Audits
- Premium development can happen
- Refer to 2002 E5 Q27
- Basically you have to find this development factor
- Lets say audits cause a 2.5% increase in premium
- \(\dfrac{\text{Ult. Prem Dev Lvl}}{\text{Latest Prem Dev Lvl}}\), where the latest prem dev lvl
- \((0.5 \times 1.0 \times 1.025\text{ (audited)}) + 0.5 \times 1.1\) where,
- 0.5 \(\to\) first half of the year (before the rate change)
- 1.0 \(\to\) Rate level before the rate change
- 1.025 \(\to\) Since, only the first half of the year was audited, the latest will have this…
- and Ult. Prem Dev lvl is \(1.025 \times (0.5 \times 1.0 + 0.5 \times 1.1)\) where,
- both halves of the year are audited
Selection Rules
- PP selection rules
- If no obvious pattern \(\to\) select weighted average
- LR selection rules
- If no obvious pattern, no outliers \(\to\) selected weighted average
- Premium selection rules
- Find the average premium to look for trends (and take action based on that)
- Age-to-age factor selection
- You can assume that the downward trend is just random fluctuations (reasonable, because random things can happen in such a way)
- When asked to justify the selection:
- Justify the selection with some apt reasons such as
- Can be explained by a change in reserving philosophy
- Then say what would be well representative of the future.
- Then also tell what you will do for the rest of the development periods,
- Select a straight average.
- Justify the selection with some apt reasons such as
- NOTE: You can also write in brackets (medial average is also reasonable) if you feel there are two correct answers.
Trend Periods
- Fixed Expenses
- Period: From avg Written date to avg Written date
- Reason: Fixed expenses are incurred at the beginning of the policy term. Avg of those start of policy terms would be the average written date.
- Exception: Separate fixed expenses that are incurred throughout the policy term
Big Pictures
The sub-bullet points here are just explanations that can be omitted from the explanation when being written in an answer!
Shock Loss
- Remove the large loss event (floods, weather events, fires etc) from the data
- Calculate the non-cat Loss & ALAE ratio from the data excluding this event
- Create a catastrophe load using a longer term average of catastrophic losses
- Catastrophic loss to AIY ratio (weighted average)
- Projected AIY per exposure
- ULAE load
- \(\implies\) Catastrophe load
- Obtain a cat-loaded LR \(\implies\) Obtain final indication