Multivariate Classificaiton
- Correctly adjusts for exposure correlation between rating variables
- Important in territorial ratemaking, since territories are generally highly correlated with other rating variables.
Remember, #Loss Ratio Approach and #Adjusted Pure Premium Approach just approximately correct for exposure correlation, they are not accurate like the Multivariate approaches like GLMs. So, don't use it as an answer for situations what exposure correlation is a problem. Band-aid not a solution.
Multivariate Classification
- Be able to state the main advantages and disadvantage of univariate analysis
- Be able to give reasons why GLMs have grown in usage over time.
Benefits of GLMs.
- Properly adjust for exposure correlations between RV
- Attempt to focus on the "signal" of the data (systematic effects)
- Provide statistical diagnostics (confidence intervals)
- Consider interactions between rating variables (response correlation)
Difference between Response & Exposure Correlation
- Exposure correlation:
- 75% of 16 year old drivers are male
- But, 50% of 50 year old drivers are male
- Response correlation: Effect of one variable differs based on the levels of another variable
- 16 yo males have twice the claim frequency as 16 yo females
- 50 yo males have the same claim frequency as 50 yo females
- M \(\neq\) F when
age=16 - \(M = F\) when
age=50 - Effect of Gender
- Put an interaction term to account for this.
Minimum Bias Procedure
Pros & Cons of MBP
- Advantage
- Properly correct for exposure correlation
- Disadvantage
- Don't provide ways to test if variables are statistically significant or not
- Computationally inefficient
Sequential Analysis
Method
- Perform standard univariate approach to obtain relativities for a single variable
- Perform Adjusted Pure Premium approach to obtain indicated relativities for the second variable, based on adjusting exposures as a result of the prior variable's selected relativities
- Repeat the Adj PP method for the remaining variables, having adjusted for all the prior variables at each step
Pros & Cons
- Pros
- Not iterative (one pass)
- Only class ratemaking allowed for California personal auto
- Cons
- No closed form solution (results change based on the order of variables chosen)
GLMs
Linear models: \(Y_{i} = \mu_{i}+\epsilon_{i} = (\beta_{0}+\beta_{1}X_{1,i} +\beta_{3}X_{3,i}+\dots+\beta_{p}X_{p,i}+\epsilon_{i}\)
GLM: \(Y_{i} = g(\mu_{i}) = \beta_{0}+\beta_{1}X_{1,i} +\beta_{3}X_{3,i}+\dots+\beta_{p}X_{p,i}\)
where
- \(Y:\) Pure Premium we are trying to predict
- \(\mu:\) predicted mean
- \(X:\) Rating Variables (called predictors)
- \(\beta:\) Parameters we try to estimate
- \(g(\mu):\) Link function
- non-additive relationship with response variable
- e.g., \(\ln\)-link, predictors are multiplicative, good for multiplicative rating plans
Steps
- Compile dataset with enough data for modelling
- Selecting a link function
- Specifying the distribution of the underlying random process
- MLE to calculate parameters of the model
When to use?
Why GLMs are run on frequency and severity instead of on loss ratios?
No "Loss ratio" GLMS?
- Granular on-levelling for premiums, required.
- No priori expectations of LR (since they depend on current rates)1
- Rate change \(\implies\) Obsolete LR model
- No common theoretical distribution for modelling LRs
PP / Severity / Frequency
- GLM can use more granular aspects of the book of business
- e.g.
- Coverage level models (auto BI, auto collision)
- Peril level models (fire damage, water damage)
Interpret a graph of GLM outputs for a rating variable.
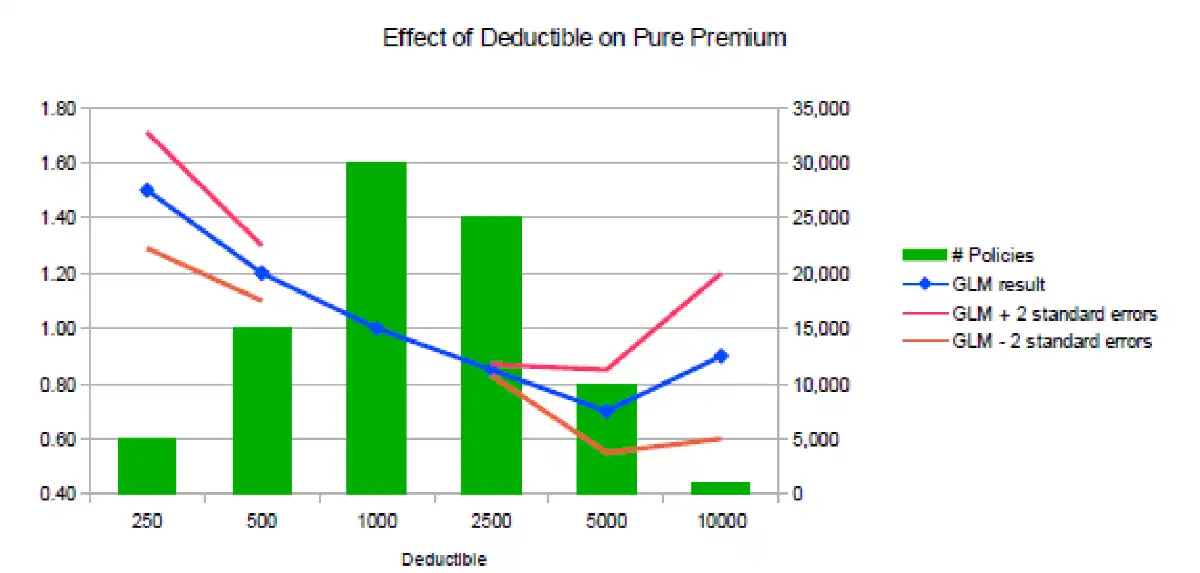
- Meta
- Exposure distribution = Green bars: 1000 deductible has most policies (Right axis labels)
- Base level = 1000 deductible, relativity = 1
- Main
- Noticeable difference between results of one-way and GLMs (particularly 2500, 5000). Potential reasons:
- Deductibles are correlated with other rating variables
- One-way analysis is not fully accounting for this correlation
- COUNTERINTUITIVE: Relativity for the 10000 deductible is higher than the 5000 deductible which is counterintuitive, since we expect higher deductibles to cost less \(\impliedby\) Limited data. RESULT WILL NOT BE IMPLEMENTED
- Noticeable difference between results of one-way and GLMs (particularly 2500, 5000). Potential reasons:
GLM Diagnostics
- Standard Errors: How wide is the confidence interval around the GLM estimate. Shows whether each level of the variable or if the variable itself is statistically significant
- Deviance Tests: \(\chi^2\) statistic, \(F\)- statistic, AIC or BIC to choose between two models with different variables
- Time Consistency: run the model on separate consecutive periods of data.. check if estimated parameters are consistent over time.
- Validation Test:
- build the model on one subset of historical data
- compare the model's predictions with the actual results on a second subset of the historical data (holdout set)
- to check if the model is underfitting or overfitting the original set.
- Judgement decision of when results seem reasonable. Deal with counterintuitive results.
Examples
Diagnostic tests to assess whether a variable should be included in a GLM.
-
Confidence intervals
- More data, smaller the confidence interval
- No significant difference between b/w impact of 5000 and 10000 deductible since CI largely overlap.
-
Deviance Tests
- Smaller the \(\chi^2-\)% more statistically significant the variable is.
- Choose the complex model if \(\chi^2\) is below 5%.
The GLM is fit with (complex) and without (simple) the variable in question. \(\chi^2\) percentage is calculated.
-
Time Consistency
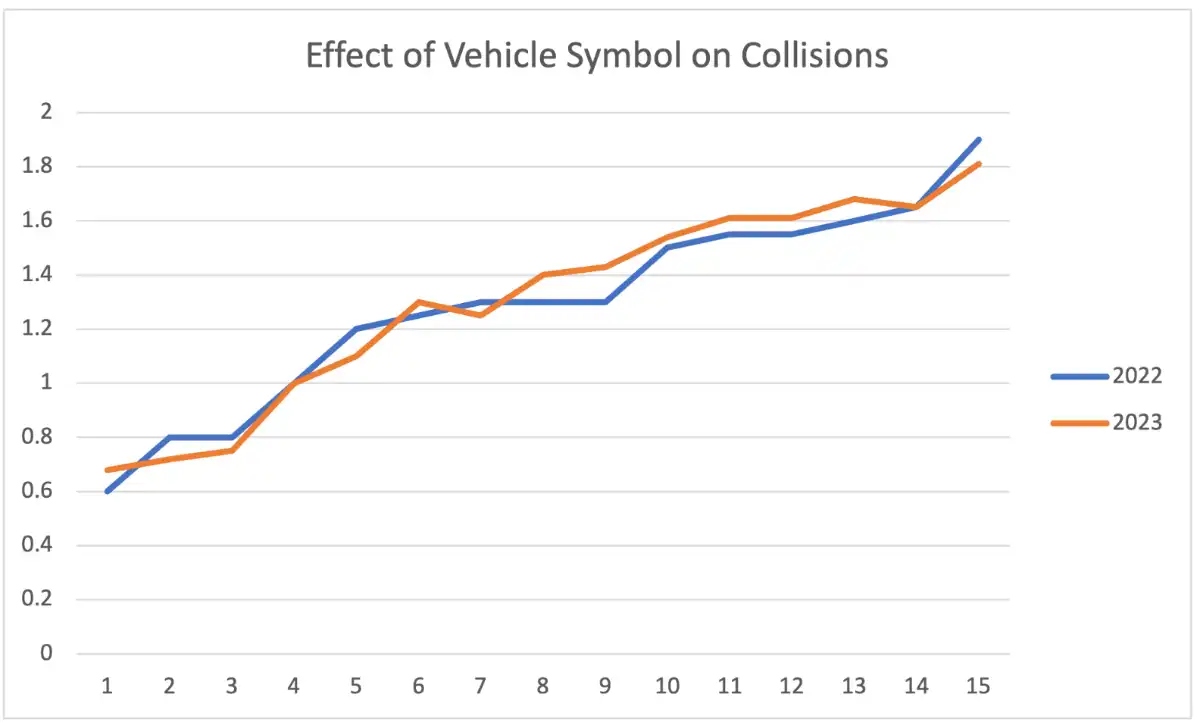
- Values of the estimated (predicted) relativities are largely close. Consistent over time.
Fit the model separately using different years from training data, compare the patterns (should be consistent across years)
-
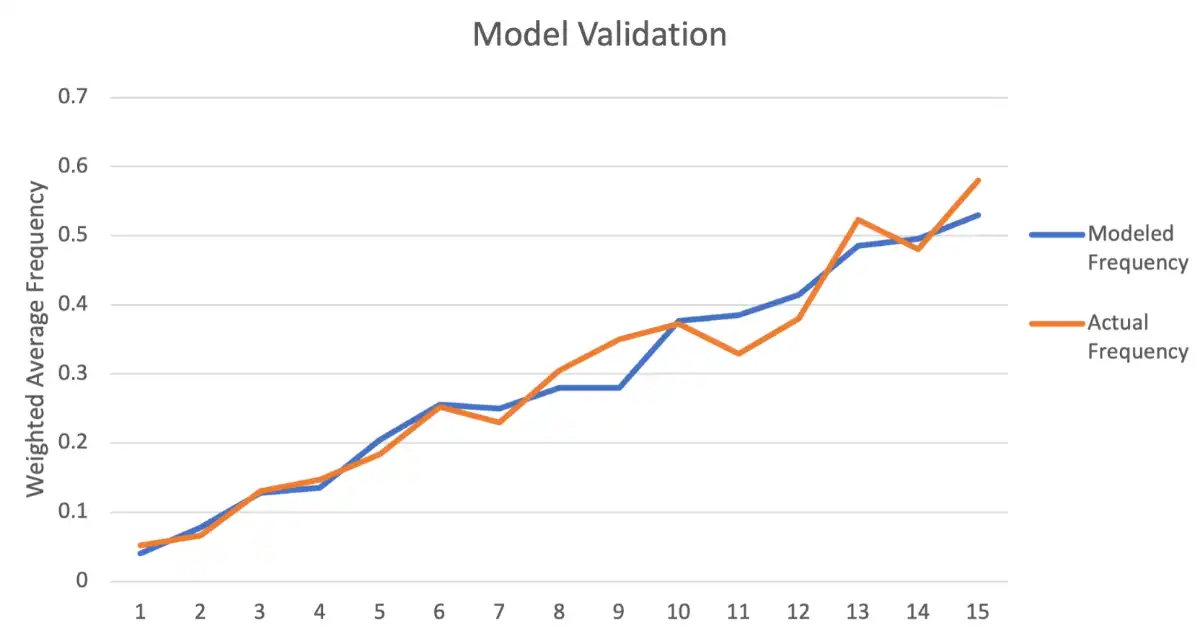
Validation Test
Use fitted model on new data \(\to\) Predictions, compared to actual to test predictive ability
- Overfit: pick up random noise
- Underfit: not have picked enough signal (less predictive power)
-
Judgement
- Why a GLM result should not be used?
- COUNTERINTUITIVE: higher rates for a higher deductible (due to less data)
Other considerations
- Reliable data: GIGO
- Explore anomalous results in the GLM (additional analysis)
- Consider both the statistical and business perspective
- Methods to communicate: Model results based on company's ratemaking objectives
Data Mining Techniques
- Factor Analysis
- Reduce the number of vars needed in classification analysis
- PCA
- Cluster Analysis
- Method to combine similar risks into groups
- CART
- Classification and Regression Trees
- if-then rules for use in classification
- MARS
- Multivariate Adaptive Regression Spline
- Helps turn: continuous var \(\to\) categorical var
- Neural Networks
- Training algorithms are given data to identify patterns
- Help identify previously unknown interactions between variables
-
Like how they have for frequency and severity ↩